How to Write a Methodology That Passes Every Review
Learn how to write a methodology that proves your research is credible and reproducible. Our guide offers practical steps and real-world examples.
Your methodology section is more than just a procedural checklist; it’s the backbone of your entire research project. This is where you lay out, step-by-step, exactly what you did and why you did it. Think of it as leaving a clear trail for future researchers to follow, proving your findings are both credible and replicable.
A well-written methodology is what gives your research its authority. It’s your chance to show the reader that you've thought critically about your approach and that your results are built on a solid, defensible foundation.
The Blueprint for a Rock-Solid Methodology
This isn't just another chapter to get through—it's the engine of your research. A strong methodology convinces your audience that your work is trustworthy. You're not just listing procedures; you're building a logical case for the path you took from your initial question to your final conclusions.
It’s all about the "why." Why did you choose a quantitative approach instead of a qualitative one? How did you find your participants, and what makes that sampling method the right choice for this study? What specific statistical tests or thematic analysis techniques did you run? Answering these questions with confidence is what elevates a simple description into a powerful, compelling methodology.
Core Components of a Strong Methodology
Every field has its own conventions, but a robust methodology almost always covers a few key areas. It should tell a clear story of your research journey.
Research Design and Approach: This is your big-picture strategy. Start by stating if your study is quantitative (all about the numbers), qualitative (focused on meaning and experience), or a mixed-methods design that blends both.
Data Collection Methods: Get into the nitty-gritty here. Describe your participants, how you selected them (your sampling technique), and the tools you used, whether it was a survey, an interview guide, or a lab experiment. Lay out the exact procedure from start to finish.
Data Analysis Plan: How did you make sense of all the information you gathered? Explain the software you used (like SPSS or NVivo) and the specific analytical techniques you applied, such as regression analysis or content analysis.
Ethical Considerations and Limitations: No study is perfect. A great methodology is transparent about its potential weaknesses or constraints. It also shows you’ve covered your ethical bases, like getting informed consent and ensuring participant anonymity.
Ultimately, your methodology is the bridge connecting your research question to your results. It’s where theory gets real. Before you can even start writing this section, you need a clear vision of what you’re trying to accomplish. For help structuring that initial thinking, looking at some conceptual framework examples can give you the solid foundation you need. When you get this blueprint right, your entire project stands on a foundation of rigor and integrity.
Choosing Your Core Research Approach
Before you write a single word about your specific procedures, you have to make a foundational decision. Think of it as choosing the lens through which you’ll view your research problem. This choice—your core research approach—sets the stage for everything that follows.
The three main paths you can take are quantitative, qualitative, and mixed-methods. This isn't a random choice; it has to be a direct, logical answer to your primary research question. The easiest way to start is by thinking about your end goal. Are you trying to measure, test, or predict something? Or are you more focused on exploring, understanding, and interpreting human experiences?
This decision tree gives you a quick visual guide based on the kind of question you're asking—whether it’s "How Much?", "Why?", or a bit of "Both?".
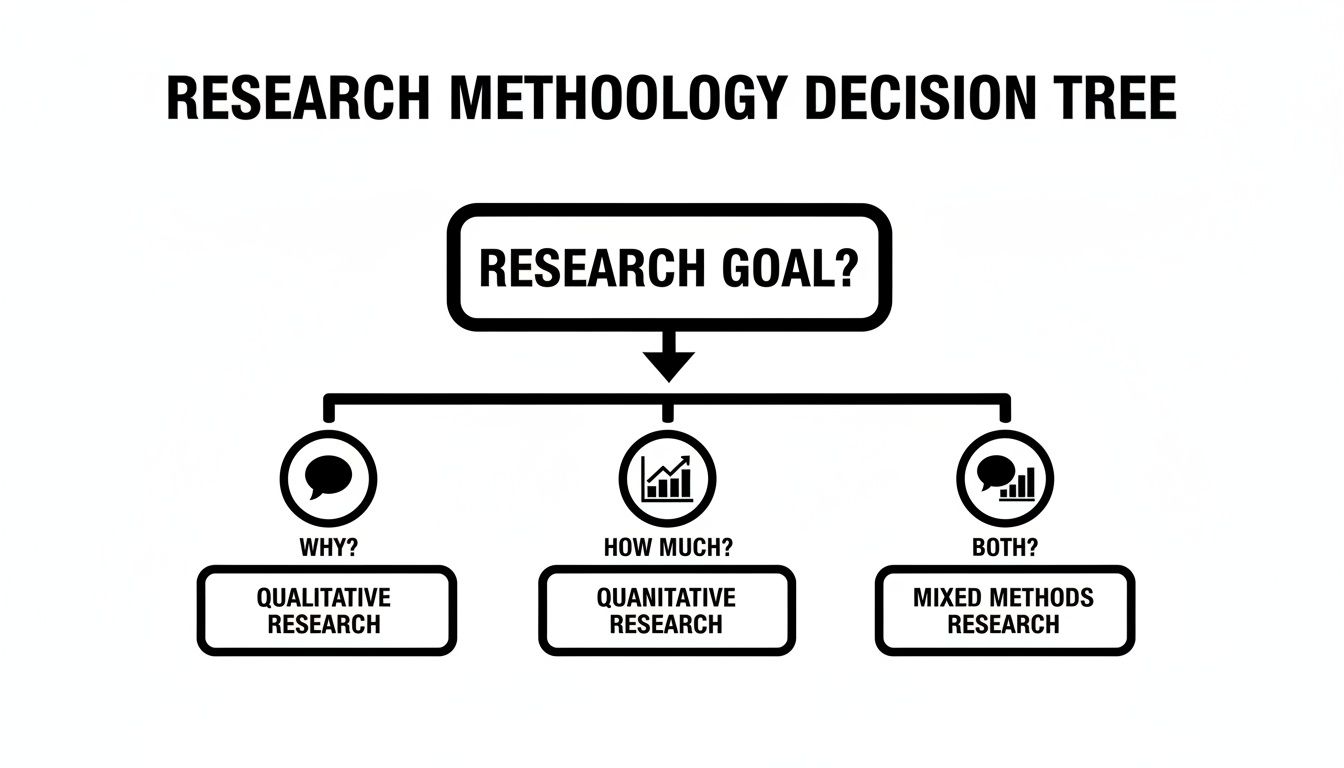
As you can see, the nature of your question points you directly to the right methodology. If you're measuring, you're in quantitative territory. If you're seeking to understand, you're looking at qualitative. And if you need to do both, you'll be blending them.
Comparing Research Methodologies
To make the choice clearer, here’s a quick-reference table that breaks down the core differences between the three approaches. It's a handy guide to consult when you're weighing which path best aligns with your study's objectives.
| Approach | Best For | Data Type | Common Methods | Example Research Question |
|---|---|---|---|---|
| Quantitative | Testing hypotheses, measuring, and predicting. | Numbers, stats, graphs. | Surveys, experiments, correlational studies. | To what extent did the new ad campaign increase website traffic? |
| Qualitative | Exploring ideas, understanding experiences, and uncovering 'why'. | Words, themes, observations. | In-depth interviews, focus groups, case studies. | Why are users abandoning the checkout process on our mobile app? |
| Mixed-Methods | Confirming findings with numbers while also exploring the deeper context. | Both numerical and non-numerical. | Surveys followed by interviews, embedded case studies. | How has remote work impacted employee productivity (quantitative) and what are their lived experiences with it (qualitative)? |
Choosing the right path from the outset is what makes a study clear, logical, and ultimately, defensible.
Understanding Quantitative Research
The quantitative approach is all about the numbers. It’s built on statistics, objective measurements, and hard data. You use it when you need to test a hypothesis, identify cause-and-effect relationships, or make predictions. If your research question contains phrases like "how much," "how many," or "to what extent," you're almost certainly on a quantitative track.
Let's say a marketing team wants to measure the impact of a new ad campaign. They'd gather numerical data—sales figures, website clicks, conversion rates—and run statistical analyses to draw their conclusions. The big goal here is to produce results that are generalizable, meaning they can be applied to a much larger population.
Common quantitative methods include:
- Surveys and Questionnaires: Great for collecting data from a large sample using multiple-choice questions or rating scales (like a Likert scale).
- Experiments: The gold standard for establishing causal relationships by manipulating variables in a controlled setting.
- Correlational Studies: Used to see if a statistical relationship exists between two or more variables, but without claiming one causes the other.
My Take: Go with a quantitative approach when you need to confirm a theory and want statistically significant results that you can generalize. It's perfect for answering the "what" and "how many."
It's also worth noting how technology is shaping this field. The generative AI market is projected to hit $62.75 billion in 2025 and is expected to rocket to $356.05 billion by 2030. This isn't just a tech trend; it’s directly impacting how researchers and marketers build out their methodologies. In fact, an estimated 90% of content marketers will be using AI by 2025 to help produce more robust content, including well-structured methodology sections. You can dig into more of these fascinating marketing statistics on seo.com.
Exploring Qualitative Research
When your research is driven by the need to understand the "why" behind what people do, think, or feel, qualitative is the way to go. This approach deals with non-numerical data—think interview transcripts, open-ended survey answers, and detailed observational notes. It’s all about generating rich, deep insights within a specific context.
Picture a product developer trying to figure out why users are frustrated with a new app. Instead of a survey asking for a 1-5 star rating (quantitative), they would conduct in-depth interviews. This lets them explore the users' emotions, uncover the exact pain points, and hear the real stories behind their frustrations.
Some popular qualitative methods are:
- In-depth Interviews: One-on-one conversations that let you dive deep into a subject.
- Focus Groups: Small, facilitated group discussions perfect for capturing collective opinions and observing group dynamics.
- Case Studies: A comprehensive investigation into a single person, group, or event.
- Ethnography: Immersing yourself in a community or organization to understand its culture from the inside out.
Leveraging Mixed-Methods Research
Sometimes, a single approach just doesn't cut it. Your research question might be too complex for just numbers or just stories. That’s where a mixed-methods approach comes in. It strategically combines both quantitative and qualitative techniques to give you the best of both worlds.
You get the broad, generalizable data from quantitative work and pair it with the deep, contextual understanding that comes from qualitative exploration.
For instance, a school district might use a quantitative survey and find out that student engagement is low across all its high schools. That tells them what the problem is. But to find out why, they could run a series of qualitative focus groups with students and teachers. These conversations might reveal issues with the curriculum or specific classroom dynamics. By combining the two, they get a complete, actionable picture of the problem.
Detailing Your Data Collection Process
Once you’ve settled on your overarching research approach, it's time to get into the nitty-gritty. This is where you lay out the exact 'who,' 'what,' and 'how' of your data collection, leaving no stone unturned. A good methodology is so clear that another researcher could, in theory, pick it up and replicate your study precisely.
Think of it less like a summary and more like a detailed recipe. You’re not just listing the ingredients; you're explaining why you chose them and the exact steps you took to combine them.
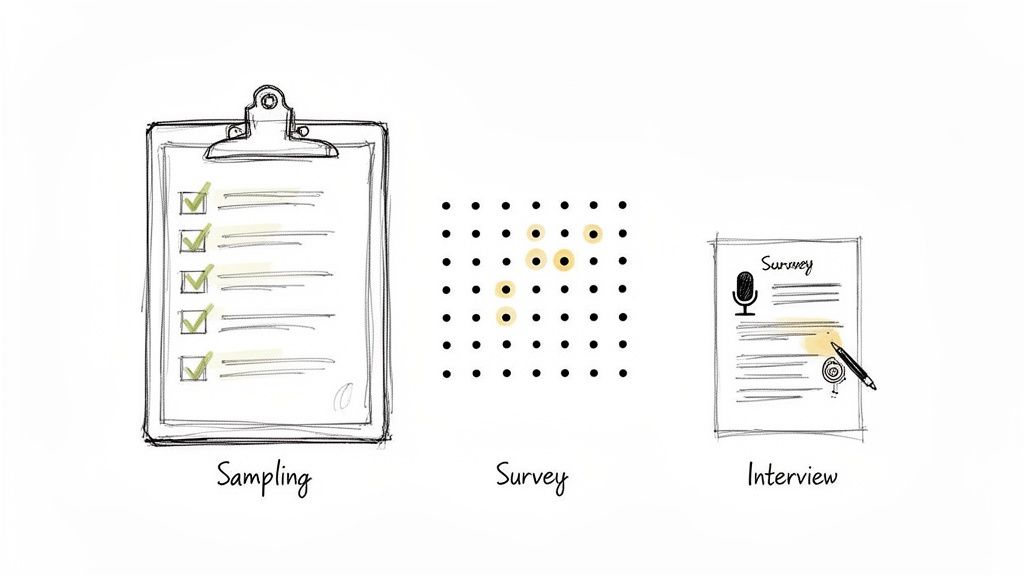
Selecting Your Participants or Data Sources
Before a single piece of data can be collected, you have to define who or what you're actually studying. This means detailing your sampling strategy—the method you used to select a manageable group from a larger population. This choice is critical because it directly shapes how far your findings can be generalized and how much weight they carry.
There are a few go-to techniques, each with its own strengths:
- Random Sampling: Often seen as the gold standard in quantitative work, this method gives every individual in the population an equal shot at being selected. It's like drawing names from a hat. For instance, if you were studying wellness among university students, you might use a random number generator to select 500 students from the registrar’s full list of 20,000.
- Stratified Sampling: This is your tool when you need to make sure specific subgroups are properly represented. You divide the population into 'strata' (like departments, class years, or age brackets) and then sample randomly from within each one. It’s a great way to avoid a skewed sample, like one that’s unintentionally 90% seniors.
- Purposive Sampling: A staple of qualitative research, this is where you hand-pick participants because they have the specific experiences or knowledge you need. If your research is about the challenges of first-generation college students, you’d intentionally seek out and recruit people who fit that exact profile.
Key Takeaway: It’s not enough to just state your sampling method. You have to defend it. Explaining why your chosen technique was the best fit for your research question is what gives your work credibility. Transparency is everything here.
Describing Your Research Instruments
With your sample defined, the next logical step is to describe the tools you used to gather the data. These are your research instruments, and you need to be precise. The goal is to paint such a clear picture that anyone reading your work knows exactly what you used.
Vague descriptions won't cut it. Get specific.
- Surveys: Don't just say you used a "questionnaire." Specify the question formats (e.g., Likert scale, multiple-choice, open-ended). If you adapted it from an existing, validated tool, say so. It’s always helpful to give a sample question or two. For example: "We administered a 25-item questionnaire using a 5-point Likert scale, ranging from 'Strongly Disagree' to 'Strongly Agree,' to measure employee job satisfaction."
- Interviews: Were they structured, with a rigid script? Semi-structured, with guiding questions but room to explore? Or unstructured and more conversational? You should also mention the average duration and how you captured the conversation (e.g., "Interviews were audio-recorded and then transcribed verbatim.").
- Observations: Explain what you were looking for and how you recorded it. Were you using a checklist to tally specific behaviors, or were you in the field taking descriptive notes?
When your methodology relies on interviews, turning those spoken words into analyzable text is a crucial step. It's worth looking into different transcription software for interviews to find a tool that can handle the workload accurately and efficiently.
Outlining Your Data Collection Procedures
Finally, you need to walk your reader through the entire data collection journey, step by step. This narrative connects your participants, your tools, and your actions into one coherent process. The best way to approach this is to imagine you're writing a manual for someone to repeat your study.
A solid procedural outline will typically cover:
- Recruitment: How did you find and get in touch with your participants? Was it through emails, flyers, a social media campaign, or a third-party service?
- Consent: Walk through the informed consent process. How did you ensure participants knew what they were signing up for, that their data was confidential, and that they could leave at any time?
- Data Gathering: Detail the sequence of events. For example: "Participants first completed a 10-minute demographic survey online. They were then scheduled for a 45-minute semi-structured interview via Zoom, which was audio-recorded with their verbal permission at the start of the call."
- Data Storage: Briefly explain how you kept the data safe and confidential. Something as simple as "All interview recordings and transcripts were stored as encrypted files on a secure university server" works perfectly.
The idea of a formal methodology chapter really took hold in academic circles around the 1920s, and today's standards for transparency are higher than ever. As technology automates more routine writing, the need for clear, human-driven explanations of our methods has only grown. For a modern study, say on AI in education, you might outline a plan using purposive sampling to recruit 300 participants, aiming for a high response rate to ensure rich data.
Laying Out Your Data Analysis Plan
Gathering your data is a huge milestone, but it's really just the beginning. The real magic happens when you start digging in and making sense of it all. This is where your data analysis plan comes in—it’s the part of your methodology where you lay out exactly how you're going to get from raw, jumbled information to clear, meaningful findings.
Think of it less as a technical chore and more as telling a story of discovery. You need to show your reader the precise steps you'll take, the tools you'll use, and most importantly, why you chose that specific path. A clear plan demonstrates that you've thought things through, which builds a ton of credibility.
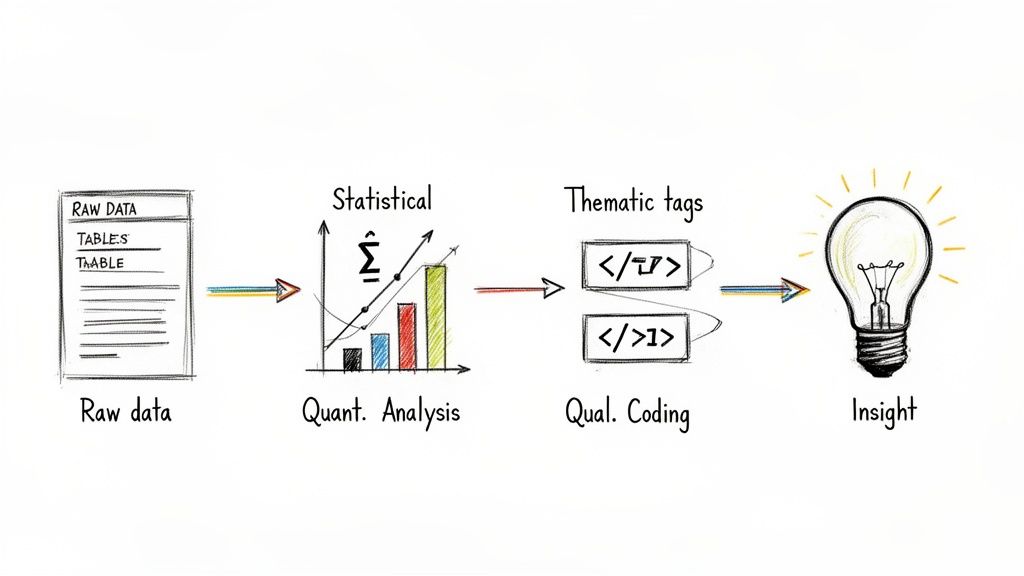
If You're Working With Numbers (Quantitative)
For quantitative research, your analysis is all about statistics. Your goal here is to spell out the mathematical steps you'll take to test your hypotheses or see how different variables relate to each other. Get specific—vagueness is your worst enemy.
Start by naming the exact statistical tests you'll be running. For instance, are you planning to use a t-test to see if there's a significant difference between two group averages? Or maybe a regression analysis to model the relationship between a few different variables? Don't just drop the name of the test; briefly explain why it's the right tool for the job based on your research questions and data type.
You’ll also need to mention the software you're using. Some of the most common workhorses include:
- SPSS (Statistical Package for the Social Sciences): A classic in the social sciences, known for being relatively straightforward.
- R: A free, powerful programming language that offers incredible flexibility for complex statistical modeling.
- Stata: A favorite in fields like economics and public health for its robust data management tools.
A rock-solid methodology isn't just a box to check—it's what makes your research reproducible and believable. It’s no surprise that journals reject up to 70% of submissions because of weak or flawed methodologies. On the flip side, studies show that papers with meticulous methods—even just citing the specific software version like SPSS 28—tend to see 28% higher citation rates.
If You're Working With Words and Ideas (Qualitative)
When your data is qualitative—think interview transcripts, field notes, or open-ended survey responses—your analysis plan shifts from numbers to interpretation. Here, you’re describing how you'll uncover themes, patterns, and meanings hidden within the text.
Your core techniques will likely be something like thematic analysis or content analysis. The key is to describe your process so clearly that someone else could follow your steps. Will your approach be inductive, letting themes emerge organically from the data? Or will it be deductive, where you start with a set of pre-determined codes based on your theoretical framework?
I find it helpful to break the coding process down into concrete stages:
- Getting to Know the Data: Explain how you’ll first immerse yourself in the material, like by reading through all transcripts multiple times.
- First-Pass Coding: Describe how you’ll start labeling interesting concepts and segments of data.
- Building Themes: Talk about how you’ll begin grouping those initial codes into broader, more meaningful themes.
- Reviewing and Naming Themes: Finally, outline how you'll double-check that your themes accurately reflect the data and give them final, descriptive names.
Just as with quantitative work, it’s good practice to mention any software that helps you stay organized, like NVivo or MAXQDA. These programs can be lifesavers for managing and sifting through huge amounts of text. If you want to explore different ways to approach this, checking out some essential qualitative data analysis methods can give you some great ideas.
Ultimately, your data analysis section is the bridge connecting your raw data to your final conclusions. The clearer you build it, the more trust your readers will have in your findings. For more pointers on this and other parts of the writing process, take a look at our guide with more research paper writing tips.
Grappling with Limitations and Upholding Ethical Standards
Let's be honest: no research is perfect. A methodology section that doesn't admit its own boundaries can actually seem less credible. The strongest research is transparent, openly discussing its limitations and demonstrating a rock-solid ethical foundation.
This isn’t about highlighting weaknesses; it’s about showing intellectual honesty and rigor. When you proactively address these points, you show reviewers you've thought critically about your research design. You’re proving you understand the scope of your work and have taken every possible step to produce valid results within those constraints. Skimming over this part can cast a shadow on your entire study, no matter how good your data is.
Building a Foundation of Validity and Reliability
Think of validity and reliability as the two pillars holding up your entire argument. They’re non-negotiable. Validity asks, "Are we actually measuring what we think we're measuring?" while reliability asks, "If someone else did this, would they get the same results?"
Your job is to explain, briefly but clearly, what you did to make sure the answer to both questions is "yes."
Internal Validity: This is all about confidence. How sure are you that your results are because of what you did, and not some other random factor? In an experiment, for instance, you’d talk about using a control group or randomizing participants to strengthen this.
External Validity: This comes down to generalizability. Can your findings be applied to other groups or situations? It's perfectly fine—and expected—to acknowledge the limits here. A study on university students in Boston, for example, probably can't be generalized to rural farmers in Nebraska, and that's okay to say.
For reliability, you can point to specific checks you ran:
- Test-Retest Reliability: Did you give a small group the same survey twice over a short period to see if their answers were consistent?
- Inter-Rater Reliability: If you had multiple researchers coding interviews or making observations, did you check that they were all on the same page? Mentioning that you calculated their agreement level (using a metric like Cohen's kappa) shows you took this seriously.
Acknowledging limitations isn't a confession of failure. It's a sign of a mature researcher. You're showing that you can critically evaluate your own work and intelligently discuss its boundaries. This move actually builds trust and strengthens your paper.
The Non-Negotiables: Your Ethical Framework
Beyond the technical details, your methodology has to be ethically sound. This is where you explain exactly how you protected your participants and handled their information with care. Getting this wrong can have serious consequences that go far beyond a rejected paper.
Keep this section clear and direct. Just state the facts of what you did.
Your Ethical Checklist:
- Informed Consent: How did you get permission? You need to explain that you told participants the study's purpose, what they’d be doing, and made it crystal clear that their participation was voluntary. They had to know they could walk away at any time, no questions asked.
- Anonymity and Confidentiality: Spell out how you protected people's identities. Did you remove names and any identifying details from your data? A simple sentence like, "All participant names were replaced with alphanumeric codes, and identifying details in transcripts were redacted," works perfectly.
- Data Security: Where did you keep the data, and how did you keep it safe? Mentioning that all data was stored on an encrypted, password-protected server is standard practice and shows due diligence.
- Institutional Approval: If your research needed a green light from an Institutional Review Board (IRB) or a similar ethics committee, state it here. Including the approval number is a great way to add another layer of credibility.
Finally, ethical conduct isn't just about how you treat participants; it's also about academic integrity. To ensure your writing is completely your own, it's worth reviewing the principles of how to avoid plagiarism. Upholding this standard across your work is fundamental to building a trustworthy professional reputation.
Answering Your Toughest Methodology Questions
Even the most seasoned researchers get stuck on certain aspects of writing the methodology. The textbooks give you the rules, but the reality of research is often messy and full of gray areas. Let's tackle some of the practical questions that pop up most often when you’re in the trenches, drafting this critical section.
How Long Does This Thing Need to Be?
This is probably the number one question I hear. Honestly, there's no magic word count. The length of your methodology is dictated entirely by the complexity of your work and who you're writing for.
A journal article might have a lean and mean methodology of around 1,000 to 1,500 words, whereas a dissertation could easily stretch to 3,000 words or more. Don't get hung up on a target number. The real goal is to be complete and clear enough that someone else could pick up your paper and do exactly what you did.
Striking the Right Balance with Detail
Knowing how much to explain can feel like walking a tightrope. You need enough detail for someone to replicate your study, but not so much that you bore them to tears with every tiny procedural step.
The litmus test is simple. Ask yourself: "Could a colleague in my field reproduce my study using only the information I've provided here?"
If you can confidently say "yes," you've probably hit the sweet spot. This means:
- Be specific about your tools. Don't just say you used a "spectrometer." Mention the make and model, like "a Thermo Fisher Nicolet iS50 FTIR Spectrometer."
- Cite the classics. If you used a well-established procedure, like a Student's t-test or grounded theory, you don't need to explain the concept from scratch. Just name the method and cite the foundational work.
- Explain your tweaks. Now, if you adapted a standard method, that’s when you need to zoom in. Detail exactly what you changed and, just as importantly, justify why that change was necessary for your study.
Think of it like sharing a cooking recipe. You'd specify "1 tsp of smoked paprika," but you wouldn't need to explain what a teaspoon is.
What Happens When My Plan Goes Sideways?
Let's be real: research almost never goes exactly according to plan. Your ideal sampling method might fail spectacularly, or a key piece of equipment might break down mid-experiment. It's a common fear that these hiccups will invalidate your work, but they won't—as long as you're transparent about them.
When things change, don't try to sweep it under the rug. Address it head-on in your methodology. You can even create a small subsection to explain the deviation, the solution you came up with, and the potential impact on your results.
A Note From Experience: Framing these shifts isn't about making excuses. It's about demonstrating your integrity and problem-solving skills. Documenting how you pivoted shows intellectual honesty and actually makes your research more credible, not less.
For instance, if your goal was to recruit 100 participants but you could only get 75, you’d state the original target, explain the recruitment hurdles, and then candidly discuss how the smaller sample size might limit the generalizability of your findings. This kind of transparency builds trust.
Tailoring Your Methodology for Different Readers
Finally, remember that you’re not always writing for the same person. The core facts of your method stay the same, but the tone and level of detail should shift depending on your audience.
Here’s a quick breakdown of how you might adjust your approach:
| Audience | Tone & Focus | Level of Detail | A Real-World Example |
|---|---|---|---|
| Journal Reviewers | Formal, highly technical. | Extremely high. The focus is on proving your work is rigorous and replicable. | "Data was analyzed using a two-way ANOVA in SPSS v.28, with post-hoc Tukey HSD tests." |
| Corporate Stakeholders | Bottom-line focused. | Moderate. They care about how your methods lead to reliable business insights. | "We segmented users based on purchasing behavior to ensure our feedback came from our key customer profiles." |
| General Public/Blog | Accessible, engaging. | Low. Focus on the big picture to show your approach was sound and trustworthy. | "We talked to 50 regular users to find out what they loved and hated about the app." |
Ultimately, a strong methodology tells a clear and defensible story about your research journey. Answering these common questions will help ensure that story is not only understood but also respected, no matter who's reading it.
When your research is complete but the writing feels daunting, Rewritify can help. Our AI-powered tool is designed to refine your drafts, turning complex academic text into clear, polished, and original content that maintains your authentic voice. Whether you're finalizing a dissertation, preparing a journal article, or drafting a report, Rewritify ensures your methodology is communicated with the clarity and professionalism it deserves. Transform your writing at https://www.rewritify.com.
Relevant articles

Learn how to structure an argumentative essay with our expert guide. We break down the thesis, body paragraphs, and counterarguments for a powerful paper.

Learn how to write an annotated bibliography with this comprehensive guide. Get actionable tips, real examples, and formatting advice for APA and MLA.

Learn how to write an effective essay rough draft. This guide provides actionable steps for turning messy ideas into a coherent and compelling paper.

Discover differences between formal and informal writing, with practical tips, examples, and syntax cues to choose the right tone every time.

Learn how to write a critical analysis with our guide. We cover everything from developing a thesis to structuring your argument and refining your final draft.

Learn how to write a position paper with our expert guide. Discover proven strategies for research, structuring arguments, and persuasive writing.